4513.0 - Criminal Courts, Australia, 2016-17  Quality Declaration
Quality Declaration ARCHIVED ISSUE Released at 11:30 AM (CANBERRA TIME) 28/02/2018
Page tools:
 Print Page Print Page
 Print All Print All
| ||
NEW SOUTH WALES DEFENDANTS FINALISED In 2016–17, there were 156,652 defendants finalised in New South Wales’ criminal courts, an increase of 2,758 defendants (2%) on the previous year. (Table 15) The rate of defendants finalised was 2,279 per 100,000 persons aged 10 years and over. (Table 48) 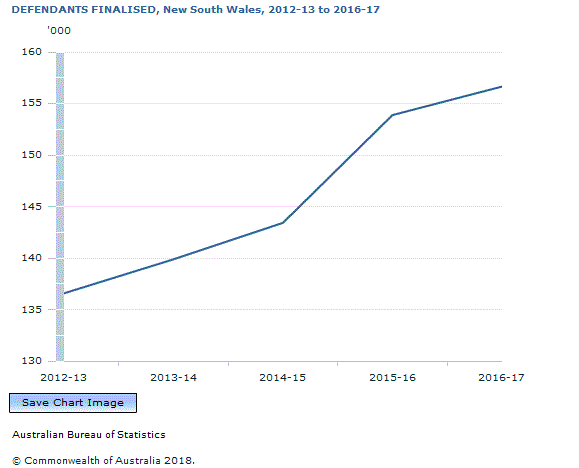 Source(s): Criminal Courts, Australia Defendants finalised in New South Wales comprised a quarter (26%) of all defendants finalised nationally. This was the second largest proportional contribution to the national total after Queensland (28%). (Tables 2 and 15) PRINCIPAL OFFENCE Over two-thirds of defendants finalised in New South Wales in 2016–17 had a principal offence of:
Between 2015–16 and 2016–17, defendants with a principal offence of:
Over the same period, the number of defendants finalised for Robbery, extortion and related offences decreased by 16% (226). (Table 15) COURT LEVEL In 2016–17, the number of defendants finalised in New South Wales’:
METHOD OF FINALISATION Nine out of ten (91% or 142,783) defendants finalised in New South Wales had their matter(s) adjudicated, meaning the court made a determination of their guilt or innocence for the offence(s) with which they were charged. Almost all of these defendants (95% or 136,145) were proven guilty. Of these:
PRINCIPAL SENTENCE In 2016–17, 15% (20,873) of defendants proven guilty were sentenced to custodial orders. Of these:
The number of defendants sentenced to custodial orders increased by 8% (1,595) from 2015–16. (Table 15) INDIGENOUS STATUS In 2016–17, the number of defendants who identified as Aboriginal and Torres Strait Islander accounted for 16% (14,349) of persons finalised in New South Wales’ criminal courts (excluding traffic offences). The most common offence amongst both Aboriginal and Torres Strait Islander and non-Indigenous defendants was Acts intended to cause injury (41% or 5,831 and 34% or 22,464 respectively). Around a quarter (27% or 3,118) of Aboriginal and Torres Strait Islander defendants who were proven guilty in 2016–17, were sentenced to custody in a correctional institution, compared to 15% (7,893) of non-Indigenous defendants. (Table 12) OTHER KEY POINTS In 2016–17:
Document Selection These documents will be presented in a new window.
|
||
